History
When I earned my first amateur radio license in autumn of 2017 and purchased a hand-held transceiver, I wanted to know what frequencies, modes, repeaters, and times-of-day that were popular with other amateur operators near me. To accomplish this, I created a heatmap – a grid on a sheet of paper showing hours of the day down the left-hand column, and various modes and frequencies across the top of the page. Over the period of several weeks I listened to my transceiver and placed checkmarks in the grid whenever I heard activity. After some time and effort, I had a visual heatmap representation of the popularity of amateur radio in my area.
It is now two and a half years later and I continue to enjoy the amateur radio hobby, therefore I decided to take this concept to the next level by creating a software application that can run unattended while I am at work or asleep.
I have successfully used the application for:
- Determining popularity of local 2-meter and 70-cm analog and digital repeaters
- Determining popularity of 2-meter SSB by monitoring 144.200 MHz
- Monitoring the International Space Station for unscheduled 2-meter FM voice transmissions on 145.800 MHz
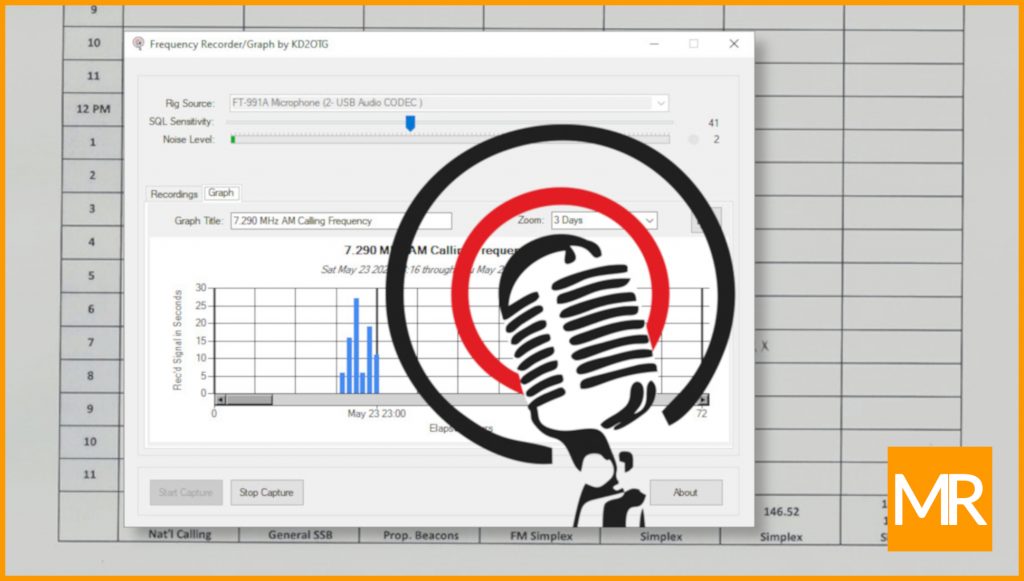
- Monitoring popularity of the 40-meter AM calling frequency on 7.290 MHz
- Monitoring VHF air band frequencies, amateur simplex frequencies, and rail/public transmissions
Download and Use for Free
Visit https://mattrobb.net/frg/
###